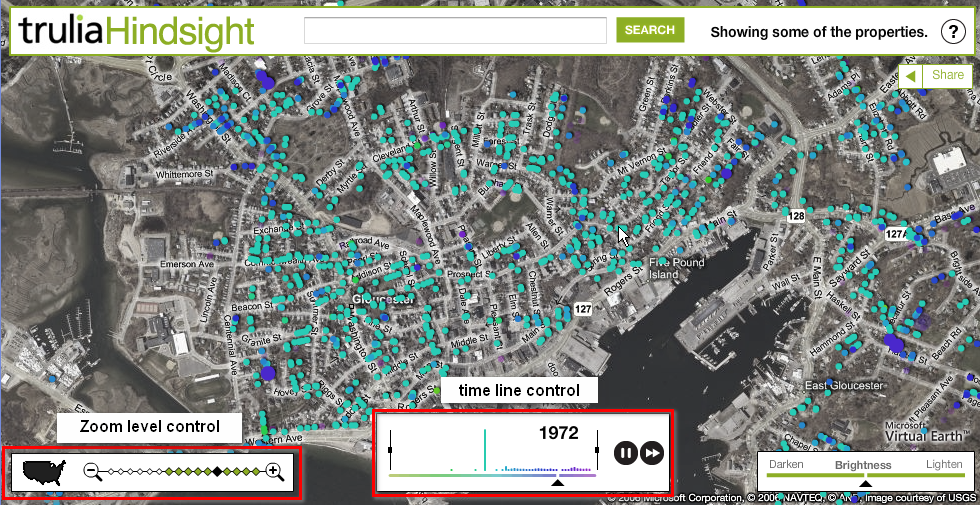
Trulia has this tool called Hindsight that lets you enter an address and watch how that area develops over time since 1800s. http://hindsight.trulia.com/map/#lat=42.464&lon=-71.074&zoom=14&mix=0.500
Things I like about the time line control
1. They match the time on the time line with the dots on the map by color.
2. You can pause, resume and fast forward
3. You can limit the duration of the time line by dragging the boundaries
Things I would change
1. I wish they won’t make it play in a loop by default. I just want it to play it once and stop at the end of the first pass. So I actually have time to analyze what I am seeing.
2. Since they have the data for each node on the map, why can’t I hover/click on each node to get more details?
3. Color choices don’t really work for me. They seem too blended in and there is no culturally associated meaning of going from green to purple.
Google Finance also has a similar draggable boundary time line control. But it’s not a time lapsed display of events.


2 responses to “Trulia Hindsight : Time lapsed map of residential development”
Very cool! Although I would really love if they showed the land in the first screen empty and actually put the houses on it (I know I’m pushing it). I agree it would be really nice to hover and get more info.
oh and you know what I would also like it to tell me exactly how many homes were built each year.