I want to go to Visualizar’09! And not that I understand the data in the visualizations they mentioned, they are still very fascinating to look at. It’s fun to imagine what kind of real world applications you can apply these cutting edge visualization capabilities to.
From the ones mentioned in the post here : http://flowingdata.com/2008/12/02/visualization-projects-from-database-city-visualizar08/ here are my favorites as excerpted from the original post.
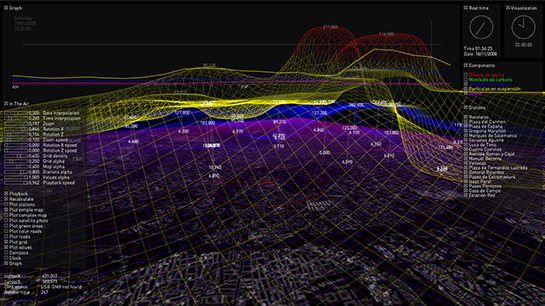
In the Air (Nerea Calvillo)
The city of Madrid currently tracks air quality through a network of sensors distributed throughout the city. This allows for the monitoring of pollutants such as sulfur dioxide, carbon monoxide and ozone at sites of traffic congestion and public interaction. In the Air uses this data to provide a (Processing-powered) realtime index of the air quality and a highly customizable interface for examining historical data. This visualization was simultaneously developed alongside a prototype of a diffuse facade – an experiment in using architecture as an ambient display for environmental information.
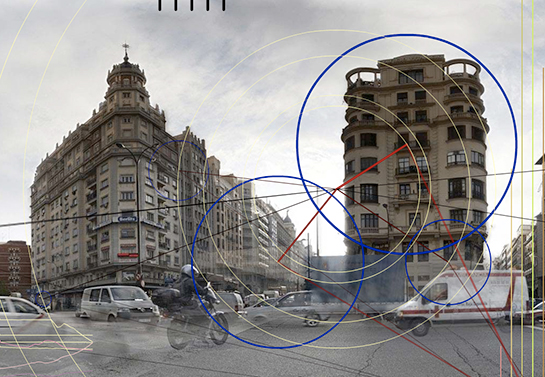
Much Ado About Nothing (Iván Huelves Illas)
Delving into the realm of subjective experience, Much Ado About Nothing utilizes noise pollution data from Madrid City Council to create virtual spaces in which to explore and discover the character and quality of sounds created at specific sensor stations. The resulting panoramic interface provides an immersive experience coupled with a graphic overlay that displays the intensity (in decibels) and source of each noise.


2 responses to “Link of the moment : From Flowing Data – Visualizar’08”
[…] Vote Visualization Projects from Database City – Visualizar’08 […]
[…] Vote Visualization Projects from Database City – Visualizar’08 […]